Leading Product Design Transformation to Drive 136% Growth and an Acquisition
InsightSquared
EXECUTION:
Product Design • UX • Visual Design • Research
PRODUCT SPACE:
B2B SaaS • Sales Analytics • RevOps • Data Visualization
ROLE:
Principal Product Designer • IC Design Manager

Breaking it down systematically, collaborating closely, and trusting the foundation I'd built, I turned a daunting challenge into a competitive advantage.
Project gallery

Current State
The Key Challenges
"Sales and support staff feel like they are spending more time explaining workflow and UX to customers"
InsightSquared used machine learning to capture and analyze sales activities, helping revenue teams optimize their processes. But the platform was facing compounding challenges:
Outdated interactions: The existing platform was built on old patterns that intimidated users and created unnecessary friction
Two conflicting platforms: The startup we acquired had newer ML capabilities with better interaction patterns, but we couldn't simply bolt it onto the legacy product, both needed fundamental rethinking
Disruptive workflows: Critical features like dashboard editing forced users to switch screens, interrupting analysis and breaking flow
Resource constraints: I was the only designer supporting a 150-person team building a complex analytics platform
With 25% of customers flagging these usability issues, we weren't just dealing with interface problems, we were facing potentially stagnating growth.
My Approach
I reframed this challenge: as a solo designer supporting a 3 pillar platform, I couldn't scale through output alone. I needed to build leverage through smart design, a solid design system, and strategic bets on high-impact features.
Building the Foundation
I developed workflows and habits to manage the workload efficiently, tracking the roadmap and production schedule closely. This meant making deliberate decisions about when to innovate and when to streamline—paring down feature designs that would consume more time than we could afford.
To gain executive buy-in for a full redesign rather than incremental fixes, I presented a complete vision: how we could implement the transformation, what the benefits would be, and how it would directly address the usability crisis affecting a quarter of our customer base.
Research as Strategy
I conducted multiple rounds of interviews with internal and external users, synthesizing findings into an empathy report that influenced roadmap prioritization. This gave the PM and CPO an objective view of where the platform was succeeding, where it was adequate, and where it was failing.
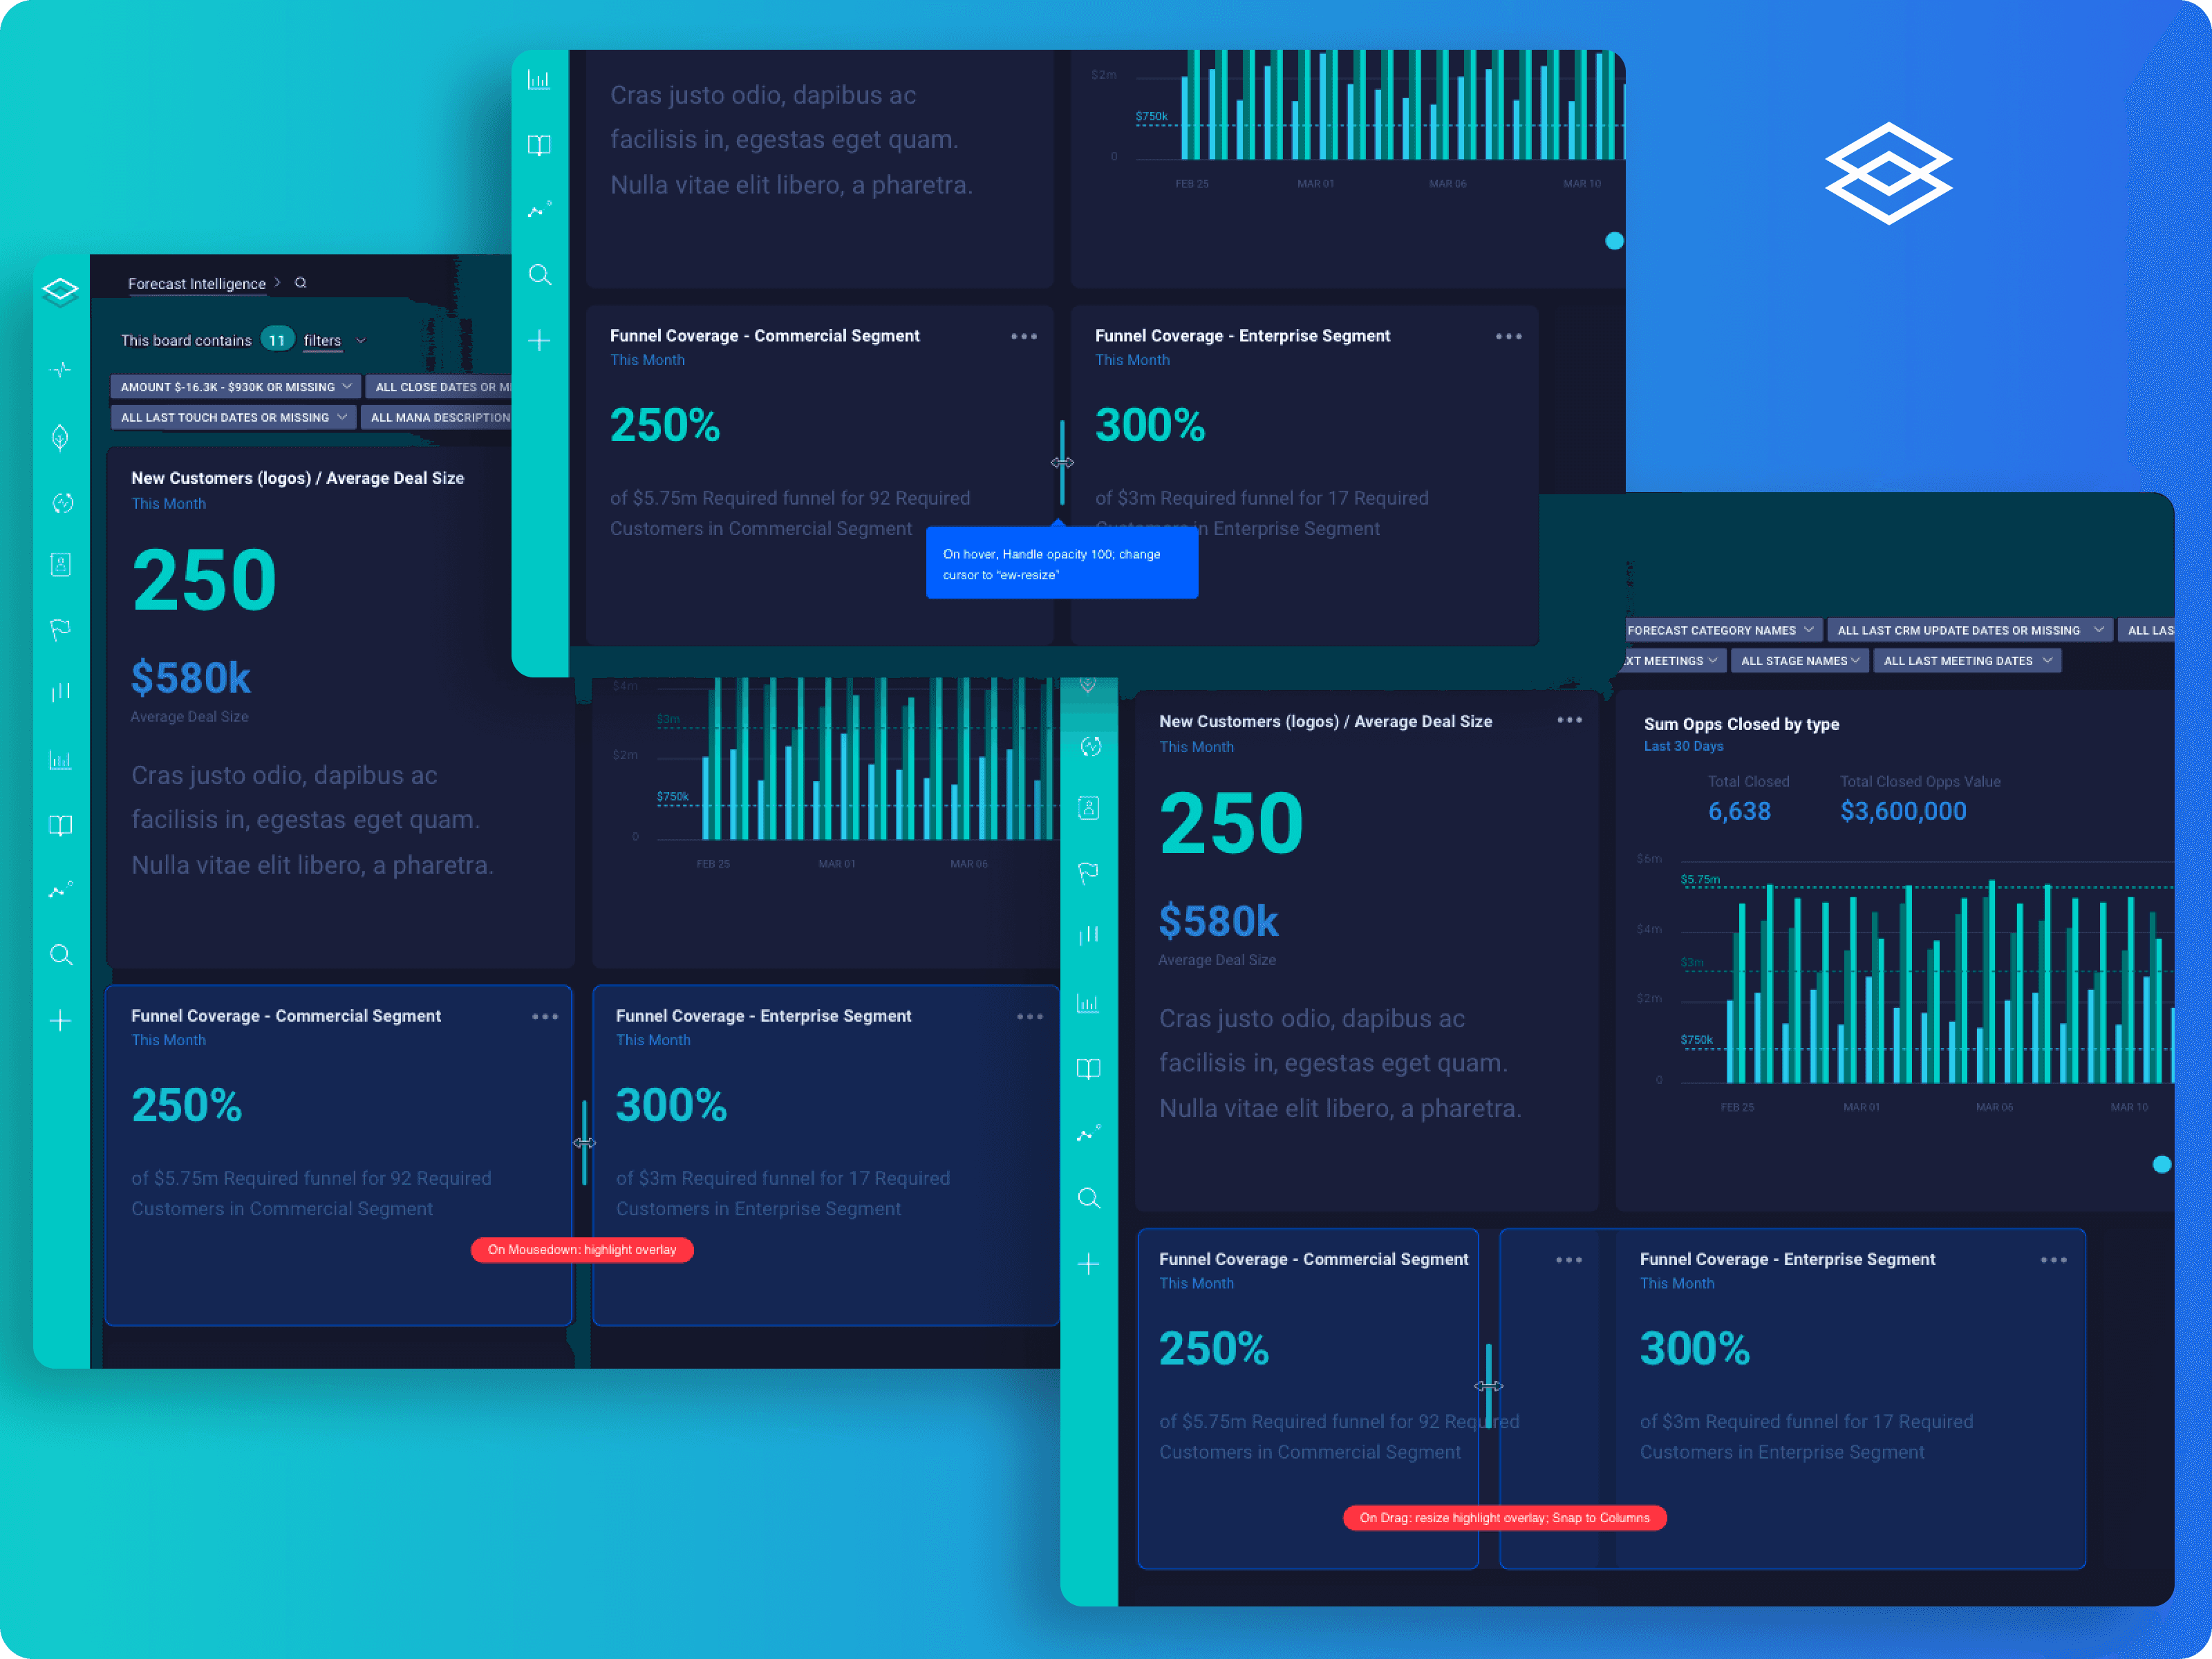
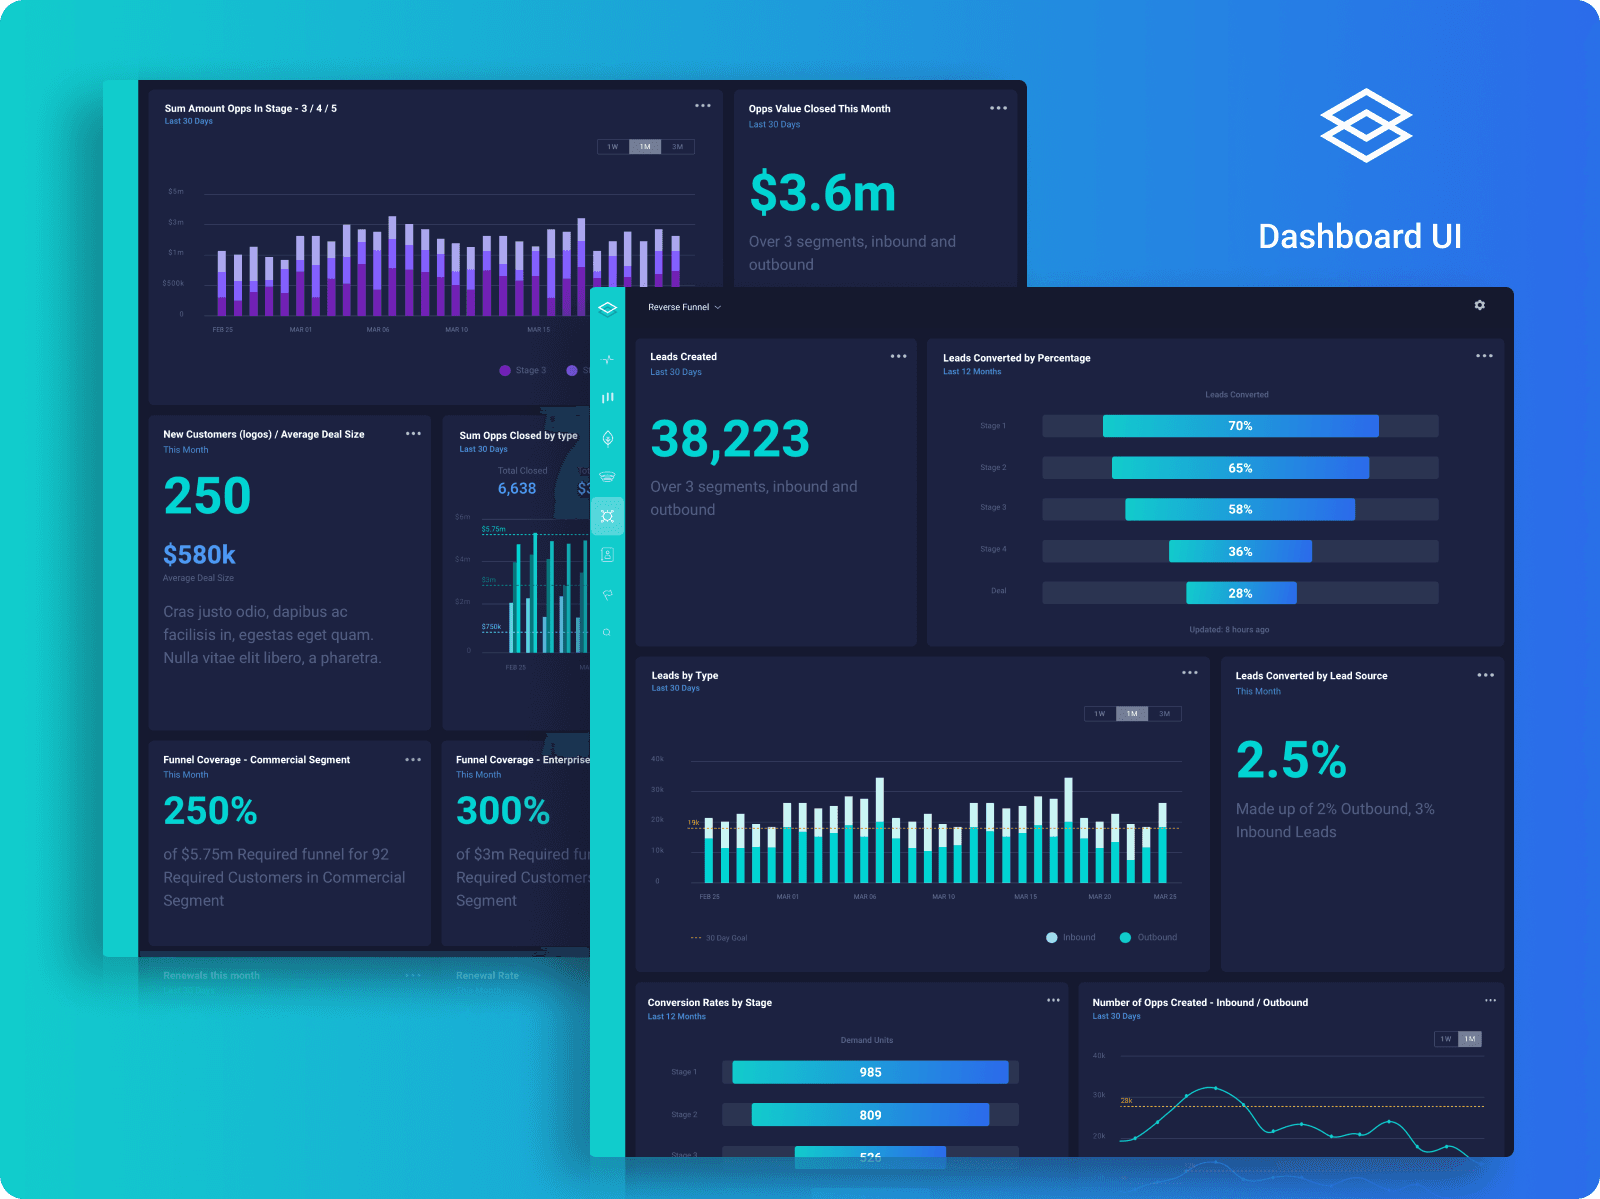
The research revealed a critical insight: users didn't lack features—they lacked guidance and contextual help. I focused on making workflows simple through progressive disclosure, clear labeling, and intuitive UI that reduced cognitive load.


Design
Design Strategy & Execution
I approached the redesign with three core objectives:
Merge two platforms with conflicting interaction patterns into a cohesive experience
Make ML complexity invisible while maintaining analytical depth
Eliminate disruptive workflows by redesigning interactions for single-screen efficiency
The Big Bet: Rethinking Dashboard Interaction
One feature became the core of the entire redesign philosophy: drag-and-drop dashboard editing. The original approach forced users to switch to a separate "board editor" screen to rearrange dashboard cards. While powerful, it was disruptive—every time someone wanted to reorganize metrics to tell a better story, they had to leave their analysis, manipulate a miniature dashboard representation, then return to their work.
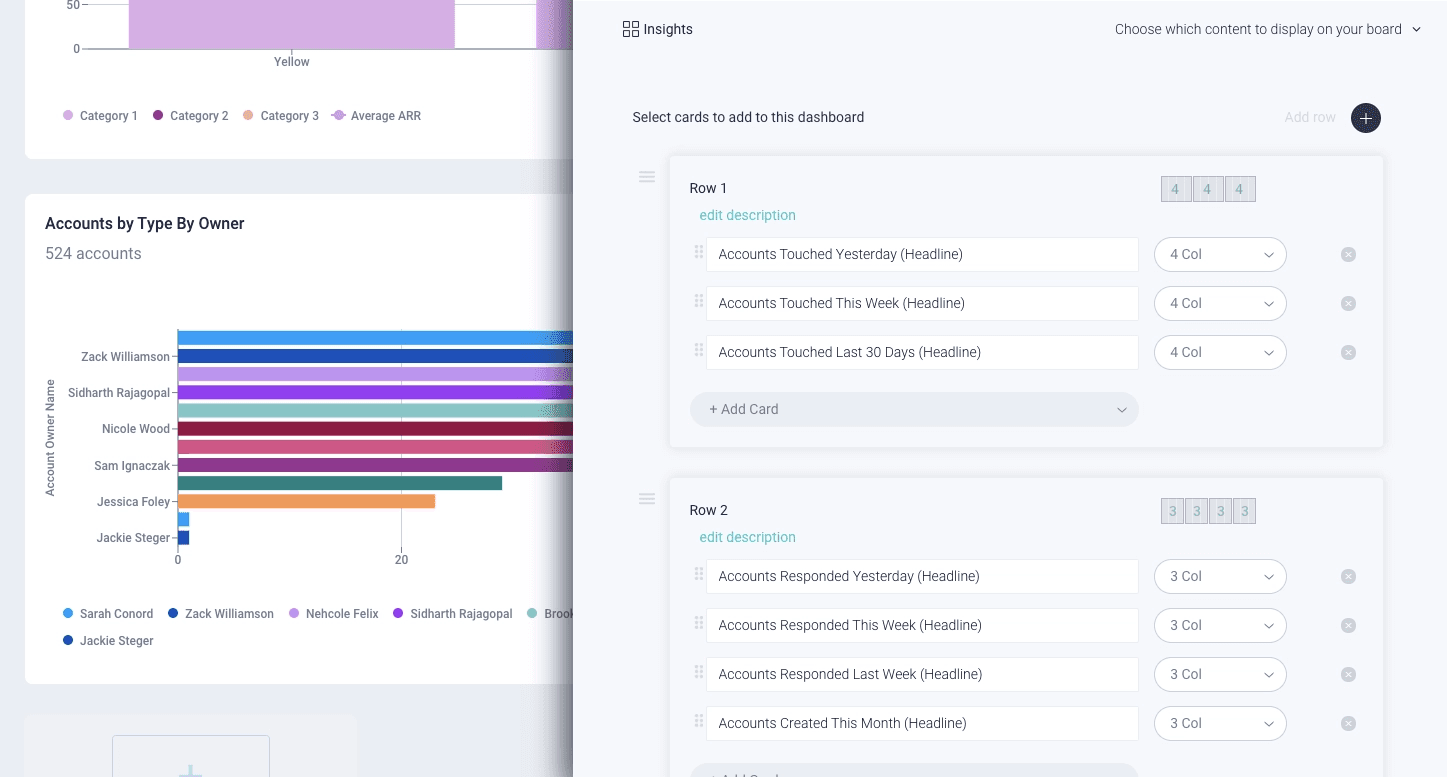
Side panel dashboard editor – originally users went to this panel to reorganize or resize dashboard cards
I redesigned this to allow front-end editing directly in the dashboard view. Users could now drag, resize, and reorganize cards without leaving context. It was unexpected—most analytics platforms at the time used separate editing modes—but it aligned perfectly with user expectations of how modern interfaces should work.
A single-screen-driven workflow enabled rapid dashboard and metric card management, even on the most dense boards.
The streamlined interaction enabled uninterrupted workflow and rapid dashboard management, even on the most dense boards. Users immediately embraced the change, and this single feature drove more than half of the 88% engagement increase we saw post-launch.
Key Design Principles
Progressive disclosure to manage ML-driven complexity
Single-screen workflows to eliminate disruptive context-switching
Contextual guidance to support users with varying technical abilities
Invisible UI that stayed out of the way of analysis
Key Outcomes & Impact
he redesigned platform became a growth engine.
Business Impact:
136% growth post-redesign
88% increase in user engagement (drag-and-drop drove >50% of this lift)
73% decrease in administrative costs
33% rise in NPS
Higher-value contract engagements across the customer base
Lasting Change:
The design transformation stuck. By establishing a strong design language and robust design system, I set InsightSquared up for continued platform development and growth. The company was acquired a few months after I left, with leadership crediting both the design transformation and improved UX as key factors in making the platform attractive to the acquirer.